Following from the previous post, there might be instances where the user might need to change the cut-off scores for the various grades so that a desired percentage of students is obtained for each grade – also known as grade moderation. Let’s look at how the code from the previous post could be modified to achieve this application.
In this example, we will work with a dataset consisting of 100 students, with a raw score range between 20 to 98. The scores will be split into 3 different grades A, B and C.
Let us consider the block of code below. The code shown would not start from Line 1 or have continuous Line numbering as with previous post, as some comments/notes present in the code has been omitted for simplicity sake.
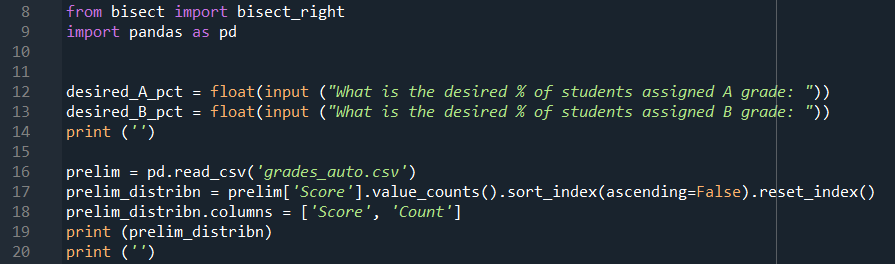
Line 8 imports the bisect_right module, and Line 9 imports pandas that will be used for handling the data.
Line 12 and 13 asks the user to input the desired percentage of students to be assigned the A and B grade. Note that it is not necessary to ask for the inputs for the last grade category as the remainder would be assigned the last grade category.
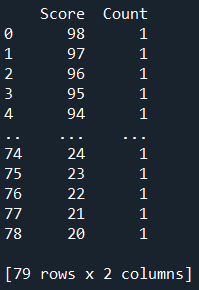
Line 16 creates a prelim dataframe with the data from the .csv file. Line 17 then counts the number of occurrence of each score, and arrange the result in descending order from the highest score. The column headers are renamed in Line 18. The prelim_distribn dataframe will be displayed in the IPython console as shown below when the final code is finally executed.
Line 22 creates the variable of the total number of students in the dataset.
Since the prelim_distribn dataframe is organised from the highest score to the lowest, we want to work our way down the rows such that the cumulative number of students will correspond to the percentage of student that the user desire. (For a small dataset, the exact percentage might not be achieved, but this code will give the cut-off score that provides the percentage closest to the desired value.)
Line 23 calculates the cumulative number of students getting the top A grade based on the percentage input from Line 12. For the next grade category, it will be an addition of desired percentage of students getting the B grade to the percentage of students getting the A grade.
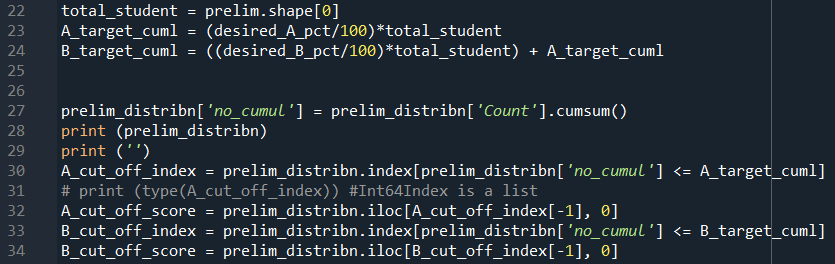
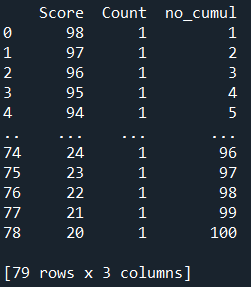
Line 27 creates a new column for the cumulative numbers as shown below.
Line 30 will search of the index in the prelim_distribn dataframe where the value in the no_cumul column is less than or equals to the user input for % A grade. The A_cut_off_index returns as a list so the last value in the list will be the best value to choose. Line 32 uses A_cut_off_index[-1], which is the last value in the list, to provide the row index of the dataframe, and the respective first column will give the cut-off score to be used. Similarly, the cut-off score for B grade is obtained in Line 33 and 34.
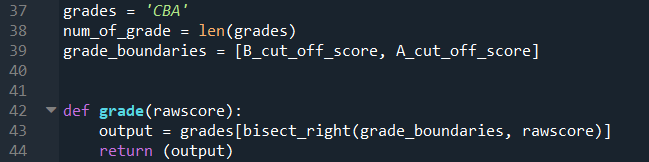
The following section of code is very similar to the previous post. As mentioned earlier, this example will just have three different grade categories. Line 39 dynamically takes the cut-off score as determined by the code described earlier in this post.
Line 42 to 44 describes the function using the bisect_right function.
The calculate() function defined in Line 46 to 88 is basically the same code from the previous post so it will not be elaborated in detail here.
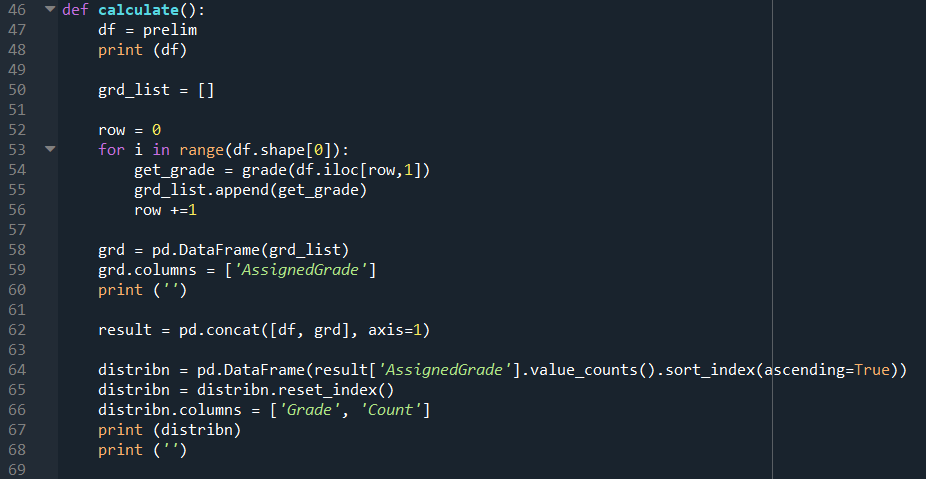
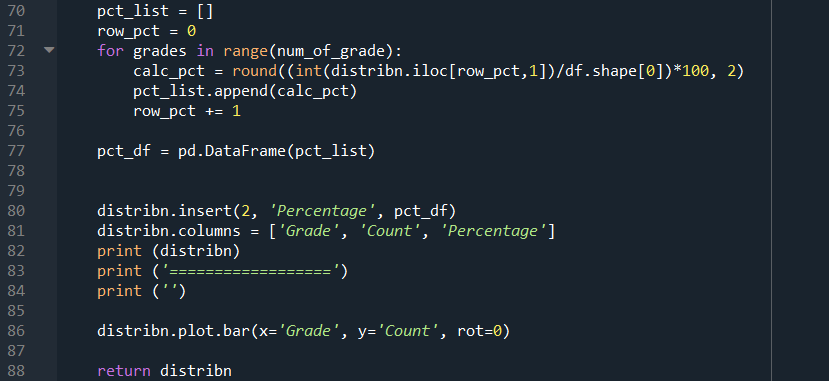
The only difference is that the output dataframe has to be returned, as shown in Line 88.
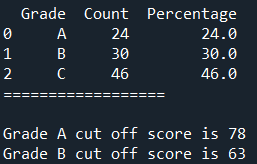
After the code from Line 8 to 39 has been executed, Line 91 calls the calculate() function, followed by printing the respective cut-off score in the IPython console.

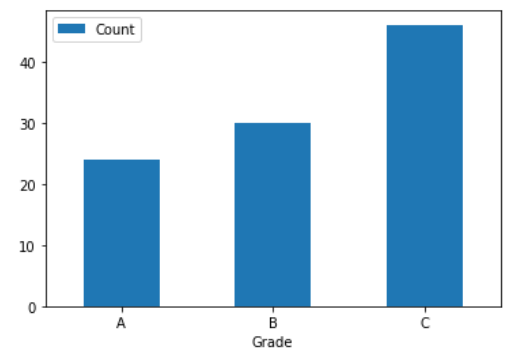
When the desired percentage of A and B grades are input as 25% and 30% respectively, the cut-off score are 78 and 63. The best cut-off for A grade would constitute 24% of the students instead.
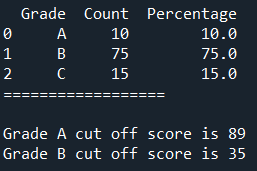
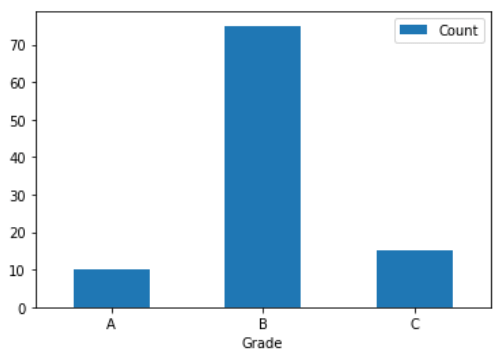
When the desired percentage of A and B grades are input as 10% and 75% respectively, the cut-off score are 89 and 35.
Is there any way to make the above codes more concise and elegant? Feel free to comment.

One thought on “Assigning Exam Grades. Part II – Moderation”