This post will be focusing on the bisect module available from Python. According to Python documentation, the bisect module provides support for maintaining a list in sorted order without having to sort the list after each insertion.
This searching and insertion into a list can be used to assist with a common task that teachers/lecturers face. To illustrate this application, the bisect_right function will be used. The first two arguments of the bisect_right function accept a list and a value, where the function will ‘find the rightmost value less than or equal to the value’.
Consider an example where you are a teacher of a class of 25 students. The figure below shows the .csv file with the exam score for each student and a grade is required to be assigned. The cut of points for each grade is as follows: A = 85; B = 75; C = 65; D = 50; F < 50. For example, a student having a score of 85 and above will be assigned an A grade.

Thus, with a list of grades and their respective cut-off values, the bisect_right function could be used to achieve this assignment of grades. Let us consider the block of code below. The code shown would not start from Line 1 or have continuous Line numbering as with previous post, as some comments/notes present in the code has been omitted for simplicity sake.
Line 8 imports the bisect_right module, and Line 9 imports pandas that will be used for handling the data.
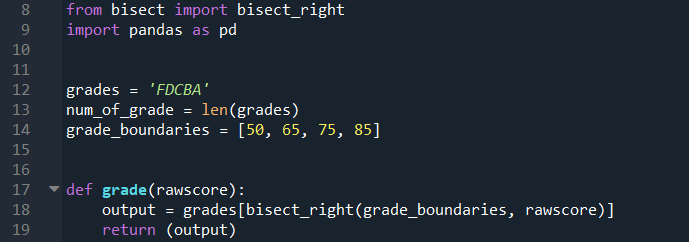
Line 12 assigns a string variable with all the different grades to be considered. Line 13 counts the number of grades that will be considered; this variable will be used later in the code. Line 14 assigns a list with the cut-off score for the grades.
Line 17 to 19 is a function that will be created to perform the grade assignment. The function will accept one argument, which is the raw score of the student, and the output of this function is the assigned grade. Line 18 would take the raw score and assign it to the right of the correct element in the grade_boundaries list. Afterwhich, the respective raw score would then be assigned to the corresponding element in the grades string depending on where the raw score is assigned in the grade_boundaries list. The grades string and grade_boundaries list are in ascending order given that the bisect_right function is used.

Line 22 read the data from the .csv file shown earlier as a pandas dataframe. Line 24 creates an empty list where the assigned grades will be stored.
Line 26 to 30 uses a for loop to go through each row of the ‘Score’ column in the dataframe, calling the grade function from Line 17 with the raw score as the argument. In Line 27, the number of iterations is assigned dynamically using the df.shape[0] variable. The df.shape method returns a tuple giving the dimensions of the dataframe (25 x 2 in this case); the first index in this tuple then dictates the number of times the loop has to iterate.
After obtaining the list of grades, Line 32 converts it to a new dataframe, and Line 33 assigns the column header as ‘AssignedGrade’.

Line 36 creates a new dataframe by concatenating the newly created dataframe with the assigned grades to the initial dataframe created in Line 22. (You can insert a print function to print out the dataframe frame should you need to take a look.)
Line 38 creates another dataframe where we count the number of each of the grades that is present in the ‘AssignedGrade’ column of the result dataframe, afterwhich the index (which is the grades) will be sorted in alphabetical order with A on top followed by B etc. The index of the dataframe is reset in Line 39, and new column headers assigned in Line 40. The distribn dataframe is printed in the Python console as shown below.

A new column could also be added to show the percentage of students having each grade.

Line 45 assigns an empty list. Line 46 to 50 then calculates the percentage of student with each grade from the distribn dataframe.
The number of iterations is updated dynamically in Line 47 using the num_of_grade variable assigned earlier in Line 13. For Line 48, the count for each grade is divided by the total number of students in the dataset (which is the number of rows in the df dataframe), and multiplied by 100 to convert it to a percentage. This is then converted to an integer and rounded to two decimal places.
Line 53 converts this list to a dataframe, which is inserted into distribn dataframe in Line 55 at the right-most column. Line 56 then renames the column headers. The updated distribn dataframe is printed in the Python console as shown below.

Line 60 makes use of the plot function within the pandas module to plot a bar chart as shown below.

Is there any way to make the above codes more concise and elegant? Feel free to comment.

2 thoughts on “Assigning Exam Grades.”