An adequately stocked consumables inventory is essential for the smooth operation of any research laboratory. Someone in the lab needs to take on the task of the regular trips to the lab store to replenish a trolley-load of consumables, lest face the wrath of fellow lab users.
In academic research labs, there is usually a roster where a different graduate/undergraduate student would be scheduled for duty each week. For labs in a research organisation, this crucial role typically falls upon the lab technician.
A typical workflow would include the lab users writing the items required on a list located in the lab, or the duty personnel doing a quick walkthrough of the lab noting down the consumable items to be replenished. Next, the duty personnel would need to liaise with the laboratory store, by sending in the physical list or sending an email, before collecting the items required.
Could this procedure be made a little easier with some Python code? Let’s see.
From the duty personnel’s perspective, the output required by him/her at the end is a list of consumable items to be submitted to the lab store. With regard to the actual collating of the list, someone (lab users/duty personnel) has to record the items at least once. Hence, digitalising this initial step and the eventual list could create an opportunity to automate this task.
A Google Form called “Lab Consumables Request” as shown below is set up to collate the lab consumable item requests. In this case, there are two fields in the form:
– “Name” field (as a short answer input) for the requestor’s name
– “Requests” field (as a paragraph input) for the consumable items

The figure below illustrates an example of how the form should be filled in.
To facilitate the Python code to read the input, each item is listed as a new line in the input field, with the following format of “Item Name – Quantity – Unit” to be used. A dash (“-“) is used to separate the information of each item. The dash should not be used within the item name itself as we are using the dash symbol as a delimiter as shown later on in this post.

With internet access available in the lab, lab users/duty personnel could easily submit their requests onto this Google Form while in the lab, at the point in time when they realised that the stock of a particular item is running low. This could be achieved with their personal smartphone and the weblink to this Google Form.
The requests are stored in the system (see ‘Responses’ tab on Google Forms) as they are submitted over the course of the week. The entire request history could be exported as a .csv file and saved to the directory where the Python code resides.
Let’s look at how the raw data is presented within this .csv file. The filename is the same as the Google Form title by default. A timestamp is included with each request submission, which could be used to filter out request entries for any particular week. More importantly, based on the format of the entry requests, each item can now be delimited by a carriage return ‘\n’ (denoting a new line), with the different information of each item delimited by a dash ‘-‘.

With the data on hand, we can now translate this raw data to a proper list of items. Let us consider the block of code below.
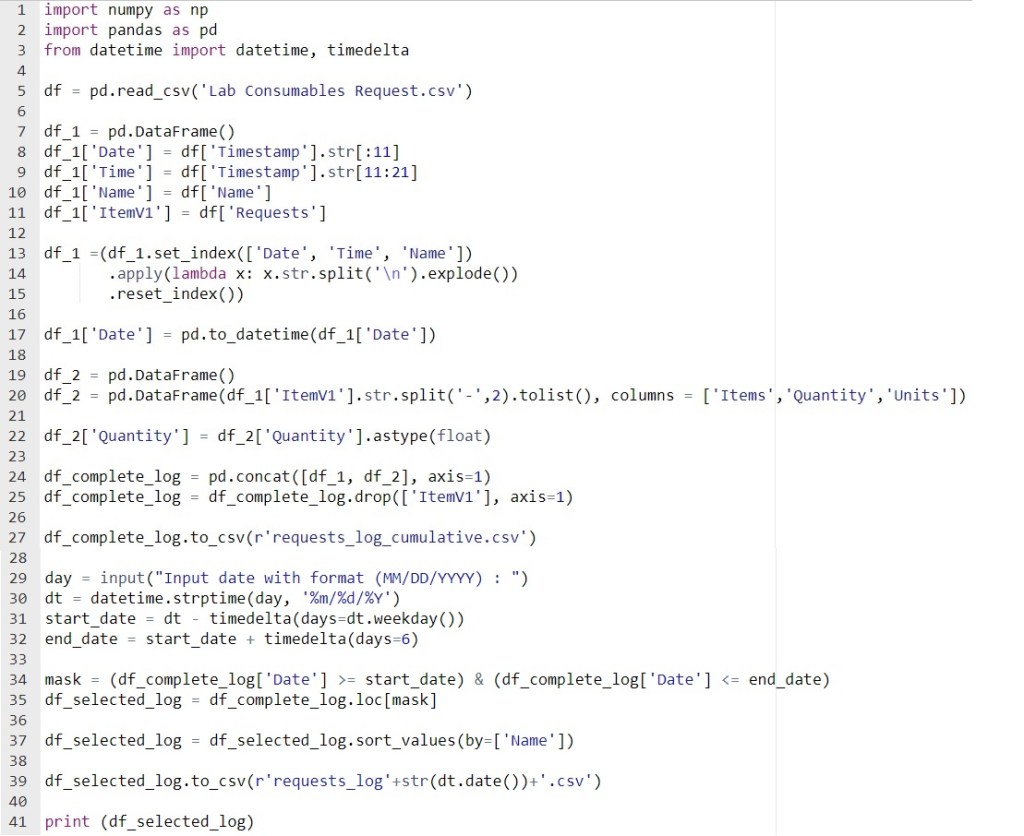
Line 1 and 2 import the numpy and pandas modules required to handle the data. Line 3 imports the datetime and timedelta function from the datetime module, which will be used to handle the timestamp information.
Line 5 read the Lab Consumables Request.csv file that was downloaded from Google Forms and placed in the same folder as this Python code.
Line 7 creates an empty dataframe which will be used to store the data extracted from Lab Consumables Request.csv file.
Based the timestamp format used by Google Forms, the respective characters in the ‘Timestamp’ column could be sliced into ‘Date’ and ‘Time’ respectively, and stored as separate columns as achieved by Line 8 and 9. Similarly, Line 10 and 11 creates the respective columns for the requestor’s name (‘Name’) and item requested (‘ItemV1’).
The problem with the data in column ‘ItemV1’ is that a lot of information is located in a single cell. Line 13 to 15 then uses ‘\n’ as the delimiter to split each of the items into a new row, while retaining their respective ‘Date’, ‘Time’, ‘Name’ column information. This is being stored in a new dataframe as well.
Previously, the dtype of the ‘Date’ column is represented as the object dtype, which is represented as a string. Line 17 converts the ‘Date’ column to the datetime dtype.
Having split the item requested (column ‘ItemV1’) into individual rows for each item, the dash ‘-‘ delimiter is next used to split this information into new ‘Item’, ‘Quantity’, and ‘Units’ columns. If the item name contains a dash, then an error will be flagged when the code is being executed. Line 19 and 20 creates a new dataframe to store data from these three columns. Line 22 then converts the data in the ‘Quantity’ column from the object dtype to a float dtype.
Line 24 concatenates these two newly created dataframes (df_1 and df_2) column-wise. As the data in the ‘ItemV1’ column has been organised and split into the required columns, the ‘ItemV1’ column is no longer required and deleted by the code in Line 25.
Line 27 then saves the concatenated dataframe as a .csv file. This .csv file will contain all the request entries to date, and thus fitting to name this as a cumulative request_log_cumulative.csv file as shown below. This list contains the requests and items sorted in chronological order.

This list is an example of the data collected over just three different dates, and is expected to get longer over time. It is not a good use of time to manually scroll and select the row corresponding to the current week.
For this example, let’s assume that the duty personnel will consolidate the list at the end of the week. There might be instances where the lab is closed for a long weekend from Thursdays (or Fridays), and the list will be consolidated on the last working day of the week. In this case, a ‘week’ is defined as a Monday to a Sunday.
Line 29 will prompt the user to input the date where he/she is retrieving the requests list. Line 30 to 32 will then determine the date range of that respective week, from Monday to Sunday.
Line 34 then creates a Boolean mask using the specified date range, and Line 35 then filters out only the entries within this date range. Line 37 sorts this list according to the requestor’s name, just to make it easier to see all the items requested by the different lab users.
Line 39 saves this filtered list as a separate .csv file with the input date within the filename. Line 41 prints out the dataframe on the Python console to allow for a quick visual check by the user. For example, when the user input the date as 24 Jan 2020, all entries in that week (20-26 Jan 2020) will be filtered.

The screenshot below shows the corresponding .csv file, with 24 Jan 2020 as the input date.

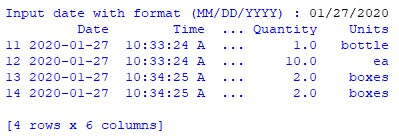
When the input date is specified as 27 Jan 2020, only the entries from the week (27 Jan to 02 Feb 2020) will be shown.

Earlier, the ‘Quantity’ column has been converted to a float dtype. This allows future opportunities to track and sum up the items given the request history of any particular lab user.
Is there any way to make the above codes more concise and elegant? Feel free to comment.
Taking this one step further, what else could be done to automate the following steps which is still done manually by the duty personnel?
– Log in to Google Forms and downloading the .csv file to the designated folder
– Running the Python code, and filtering the week’s request entries
– Auto-detect today’s date based on the computer’s clock and set that as the input date
– Sending the email, with the .csv attachment, to the lab store to request for the required items
