We’ve created a simple game in the previous post (see Guessing Game) where the positions of ‘O’ and ‘X’ are shuffled randomly, and the player gets a point for making a correct guess.
Let’s consider the scenario where someone wanted to monetise this game. Some of the considerations might be as follows:
– how much should a player pay upfront to play the game?
– what should be the minimum score before a player receives a prize?
– how should the prize received be tiered (i.e. the more points a player gets, the larger the prize)?
As this game uses a random number generated between 1 to 5, it is possible to calculate the probability of getting a particular score. Alternatively, a Monte Carlo simulation could be used to provide the same insights to the results via a code to play this game repeatedly.
The code from the previous post would be modified such that a response between 1 to 5 is chosen randomly for each round. Also, the lines of code asking for the player’s input as well as the other print out would be removed just to speed things up a little. At the end of the simulation, a graph would be plotted to visualise the results.
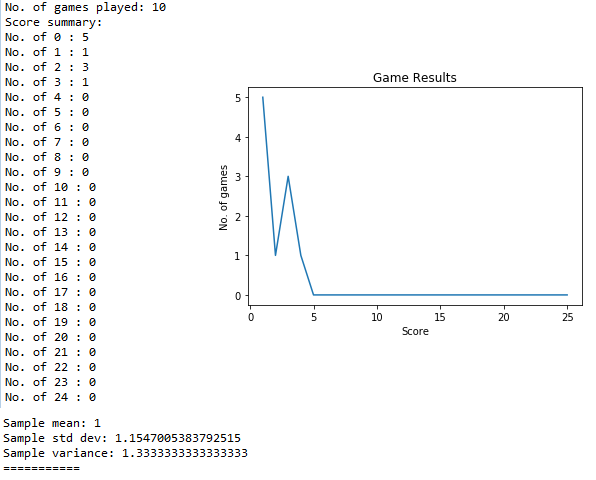
A simulation of one set of ten repeats (a sample size of 10) gives the results as follows, with the graph positioned on the right side of the image with the plot of the results for easy reference. For this particular set, five games with a score of zero was obtained, and no games with a score greater than four was obtained.
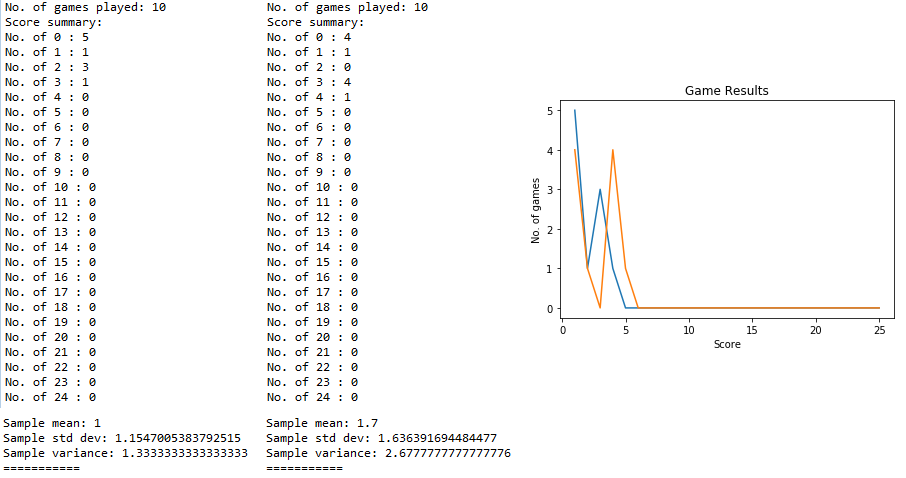
A simulation of two sets of ten repeats gives the results as follows, with the second set results in the middle and the orange line overlaid on the same graph.
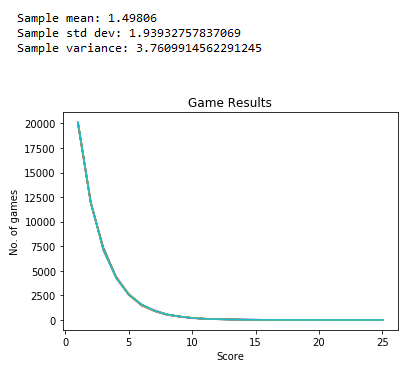
A simulation of ten sets of 50,000 repeats gives the results as follows, typically with a mean of 1.5, standard deviation of 1.9 and variance of 3.8. With such a large sample size, it is possible to have a small number of games having a score greater than 24 although it is not captured in the results here and could be deemed as insignificant compared to the bulk of the results.
Hence, with this data, how would one consider to monetise this game as mentioned previously?
The code for this programme is as follows:
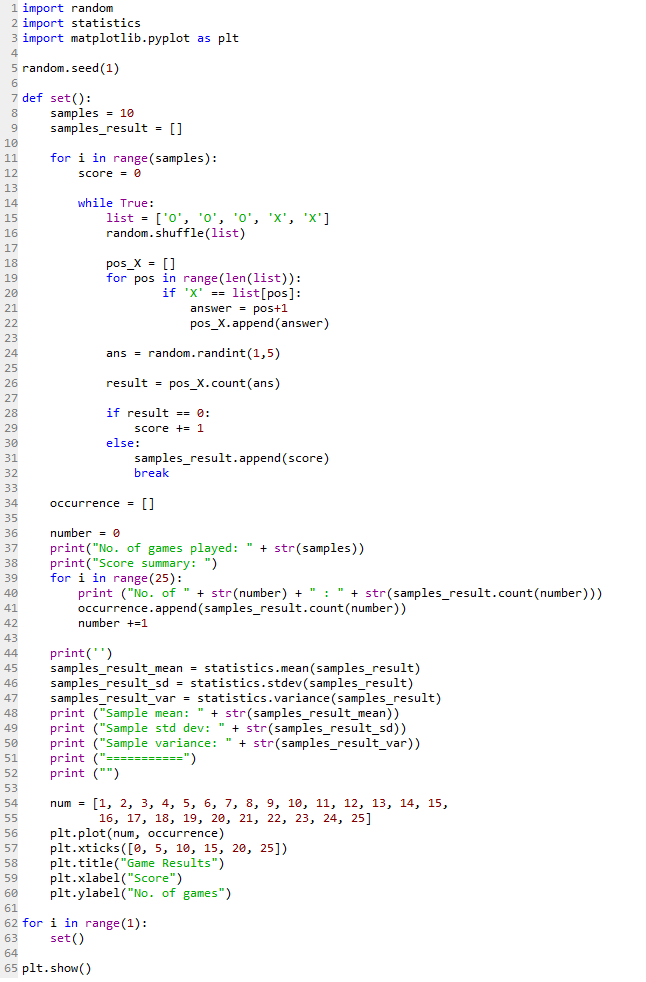
Line 2 imports the statistics module to calculate the sample mean, standard deviation and variance as shown in Line 45 to 47.
Line 3 imports the matplotlib module which is used to generate the graphs as shown earlier.
Again, a seed value (Line 5) is used to obtain reproducible results in this case.
The code for each set of the simulation is defined as a set() function from Line 7 to 60.
Line 8 is a variable for the number of repeats for each set.
Line 9 is an empty list for storing the score for each game.
Line 11 to 32 uses a for loop to repeat the game for the stated number of times, starting with a score of zero in Line 12.
Line 14 to 32 uses a while loop nestled within then plays the game and award the points accordingly.
Line 24 automates the decision making process of choosing a particular position for each round of the game played.
Line 34 creates another empty occurrence list to store the score of each game that has been played.
Line 39 to 42 counts the number of occurrence of each score and appends them to the list.
Line 54 to 60 creates the format of the graph that is to be generated.
Line 54 creates a list of possible x-axis values.
Line 56 creates a plot with the x-axis having num values, and the y-axis having the occurrence values.
Line 57 creates the major intervals that is marked on the x-axis.
Line 58 to 60 creates the graph title, and axes labels.
Although a graph has been generated, it will not be printed out on the Python console until the plt.show() command is called in Line 65, which is at the end of the simulation.
Also, for the purpose of generating a graph, the number of elements in the num list (Line 54) has to be the same as the range in the for loop (Line 39).
Line 62 to 63 then repeats the set() function for the stated number of times in a for loop.
Is there any way to make the above codes more concise and elegant? Feel free to comment.
